
Where is your webshop losing money?
We don't redesign your site on gut feeling. We measure where buyers drop out, use research to understand why, and prove with tests that the fix actually earns more. Engineering-grade CRO, for webshops.
Growth Engineering is the business development team of Emergence Engineering. The same engineering mindset, applied to revenue.
Do these numbers look familiar?
If you run a webshop, we don't need to introduce these patterns. They're all symptoms of the same system, and every one of them can be measured, fixed and tested.
- 01→
Mobile converts at half of desktop
While 60–70% of your traffic is mobile. The gap is usually a speed and checkout problem, not "mobile just being like that".
- 02→
The product page doesn't produce carts
90% of visitors leave without adding anything to the cart. Imagery, price communication, stock, trust elements: it's measurable which one is missing.
- 03→
Half of your buyers drop out in checkout
Forced registration, too many fields, too few payment methods. The most expensive loss, because you've already paid in full for these visitors.
- 04→
Email brings 5–8% of revenue
In a well-built account it's 25–35%. The difference isn't send frequency — it's flows and segmentation.
- 05→
Traffic grows, profit doesn't
Rising CAC, eroding ROAS. That's when you need the other two terms of the product, not more ads.
Before we touch anything, let's clear up the math that decides what each symptom costs you.
CAC, margin, LTV: is a customer worth it?
Three numbers decide how much growth you can afford: what it costs to acquire a customer (CAC), how much margin is left on an order after product and shipping costs, and how much a customer brings over their lifetime (LTV). With the numbers of a typical shop doing ~HUF 100M a year: 1.8% conversion, a 22,000 Ft average cart.
This is the quiet reality of most webshops: the margin on the first order just about covers the cost of acquiring the customer. Advertising alone breaks even, and profit starts with the second order. So don't stare at revenue — move two ratios: conversion divides the CAC, and repeat purchases multiply the lifetime margin.
This is the ratio Alex Hormozi keeps coming back to as LTGP:CAC: lifetime gross profit divided by customer acquisition cost. In e-commerce, above 4:1 there's room to scale; below 3:1, growth eats the margin. And there's a bonus: once the first order's margin covers the CAC, the customer finances their own acquisition. The budget cycles back, and scaling is limited by the system, not by capital.
Rule of thumb: you want at least a 4:1 ratio and CAC paid back within six months to scale calmly. If the ratio is under 3, the answer isn't more ads, it's a higher LTV.
Research, hypothesis, test, in two-week cycles
For us CRO isn't a list of tips, it's an engineering cycle. First we fix the measurement (GA4, server-side events, clean conversion points), because without it every decision is flying blind. Then the cycle drives itself:
A concrete example: at one client the order form had 11 fields. We moved contact details up to step one and deferred the rest, and abandonment dropped by 48%.
We don't deliver opinions. We deliver measured results.
What we touch, and which number it moves
One team runs the whole funnel on one shared measurement system, so a lesson learned in one place shows up across the other channels too.
| Area | Which number | How |
|---|---|---|
| Checkout and forms | Conversion | Fewer fields, guest checkout, payment and shipping options. For most shops this is the fastest win. |
| Speed and UX | Conversion | Core Web Vitals, the mobile purchase path, product page structure. With our own developers, not a list of recommendations. |
| PPC and feed | CAC | Campaign structure and feed optimization, so the same budget buys cheaper clicks and better-quality traffic. |
| Email flows | LTV and order value | Welcome, abandoned cart, win-back, back-in-stock: the customer you've won buys more, more often. |
| SEO, AIO and content | CAC | Organic presence that reduces your dependence on paid channels. |
E-commerce email automation with Klaviyo
At most webshops email brings 5–8% of revenue. In a properly built account it’s 25–35%. The difference is a segmented list, well-timed flows and clean data, not send frequency.
What goes live in the first six weeks
- Welcome series. Your new subscriber is your warmest contact, the first purchase is decided here
- Abandoned cart & checkout. Three steps, complemented with SMS
- Browse abandonment. Based on product-page intent
- Post-purchase series. Usage tips, review request, cross-sell
- Win-back. Tuned to the category’s real repurchase cycle
- Back-in-stock & price alerts. The rarest flow to ship, yet the best-converting
Four years, one system built
At Plantart we didn't tweak a single factor. We built the whole system, phase by phase. Here's how the four years looked.
- 700 M FtStarting point
A stalled SME on a single channel
A strong product but flat revenue. Barely measurable marketing, manual processes, growth that depended on the owner's time.
- Year 1
Foundations: brand, website, measurement
We rebuilt the brand and the website and wired up measurement, so we could see clearly where revenue was leaking for the first time.
- Years 2–3
The system: webshop, CRM, automation
The webshop, CRM and email automation came online, and acquisition launched across several channels, all on one shared measurement layer.
+€110,000 webshop revenue in the first year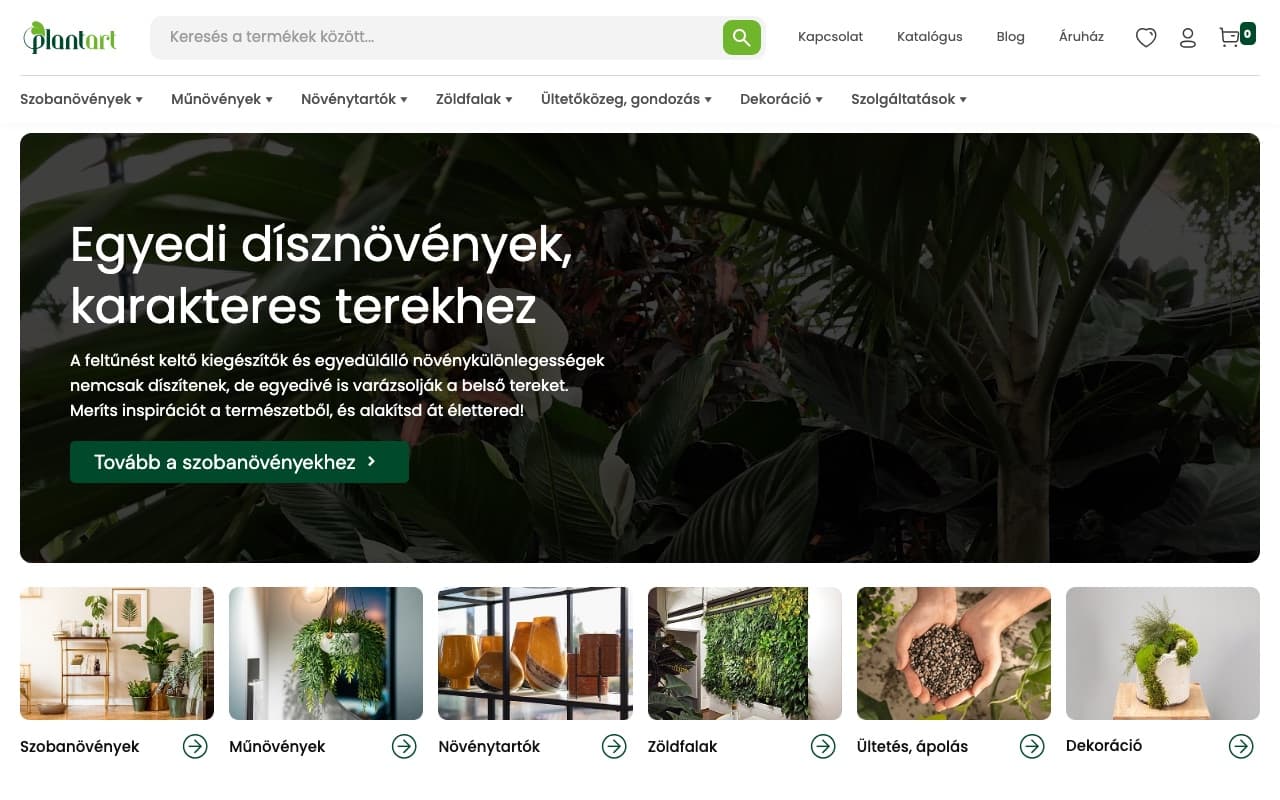 The Plantart webshop: just one channel of the whole system, most revenue is B2B
 - 1,9 Mrd FtToday
A data-driven industry leader
The stalled SME became a HUF 1.9 billion industry leader with strong B2B and B2C revenue. No single campaign did it, the whole system did.
3× revenue · −67% conversion cost · the full case study →
What experienced operators ask
How much traffic do we need for A/B testing?
What stack do you work with?
How soon do we see results?
What do we need to contribute?
We already have a marketer or an agency. Does it still work?
Start with an audit
In two weeks we go through your measurement, your funnel and your email foundation, and show you in numbers how much revenue each point is leaving on the table, and what fixing it would earn.
Thirty minutes, no pitch deck. If we don't see a fit, we'll tell you at the end of the call.